
Materials and methods
Studied area
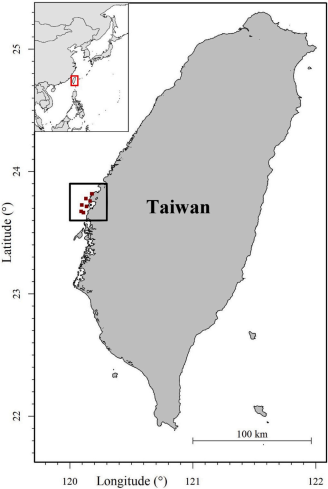
The data were from a long-term continuous monitoring program on the coastline of Taisi Township, Yunlin County, western Taiwan of the Taiwan Strait (Fig. 1). The Taiwan Strait is an essentially meridional channel connecting the East and South China Seas. The combination of monsoon and topography forcing leads to the winter blocking of northward current, spring renewal of northward intrusion, minimal blocking of northward intrusion in summer, and fall emergence of China Coastal Current (Jan et al., 2002). In summer, water originates from the South China Sea (SCS) or the Kuroshio and enters the Strait, leading to relatively homogeneous surface salinity and temperature in the Taiwan Strait (surface water salinity ~34 “ and temperature ~ 29 ◦ C). In winter, on the other hand, steady and strong northeastern winds push the fresh, cold, nutrient-rich China coastal water southward, along the western part of the Taiwan Strait, creating a salinity and temperature gradient increasing eastward (< 30 “ and 15 ◦ C at the western border and 23 ◦ C and 34.5 “ at the eastern border, Chen, 2003).

Sample collection
The monitoring was conducted at 14 designed stations at 10 m and 20 m deep, respectively, along the coastline of western Taiwan (Fig. 1) quarterly from 1996 to 2021. These stations are close to an outlet of an industrial park to monitor the effects of the effluent. Due to logistic
constraints, only 8 stations were visited continuously each quarter for 26 years. The environment variables were measured by standard pro- tocols approved by the Environmental Analysis Laboratory, Environ- mental Protection Administration, Executive Yuan, Taiwan, including water temperature (◦ C,methodology ID: NIEA W217.51 A), salinity (“, NIEA W447.20C), dissolved oxygen (mg × l − 1, NIEA W455.52C), pH (NIEA W424.52 A), concentration of chlorophyll a (mg × m− 3, NIEA
E509.02C), NO− and NO− (mg × l − 1, NIEA W436.52C), PO− (mg ×
l − 1, NIEAW427.53B), SiO2 (mg × l − 1, NIEAW450.50B),total suspended solids (mg × l − 1, NIEA W210.58 A), and transparency (m, NIEA E220.51C).
Phytoplanktons were collected by collecting 20 l of seawater at the surface using a standard water sampler, a 10-L high-density poly- ethylene carboy with a spigot. The surface water was filtered by a filter with a mesh size of 55 μm, filtered materials were collected and concentrated to 70 to 100 ml, preserved by adding a few drops of Lugol ’s solution, and stored in dark-colored glass bottles. Zooplanktons were collected by a NORPAC plankton net with a diameter of 45 cm, a length of 180 cm, and a mesh size of 330 μm. The plankton net was towed horizontally just below the sea surface at a speed of not exceeding 3 knots for approximately 5 min. A flowmeter was set at the net entrance to measure the water volume filtered. The samples collected by the plankton were preserved on-site using a 5 % neutralized formalin so- lution and stored in the laboratory.
In the laboratory, the numbers of the phytoplanktons and zooplanktons in the samples were counted and standardized into density (cells m− 3) for the phytoplanktons and abundance (individuals m− 3) for the zooplanktons. The crab and shrimp larvae, fish eggs, and fish larvae were further separated from the zooplanktons for their importance in the fisheries. Therefore, the zooplanktons in the statistical analyses indicate the planktonic animals that did not belong to any of the following categories: crab and shrimp larvae, fish eggs, and fish larvae.
Statistical analysis
The analysis of marine plankton communities was limited to the level of large categories (phytoplankton, zooplankton, crab larvae, shrimp larvae, fish eggs, and fish larvae) to deal with the uncertainty in taxa identification during the monitoring period. The data included the density of phytoplanktons, and abundance of zooplanktons, crab and shrimp larvae, fish eggs, and fish larvae as the response variables, and the pHas the effect of interest, and the transect, sampling quarters, type of the station (nearshore and offshore), surface water temperature,
salinity,dissolved oxygen, concentration of chlorophyll a, NO− , NO− ,
PO− , and SiO2, total suspended solids, and transparency as other
covariates potentially affecting the response variables. We applied the generalized additive model (GAM) to evaluate the non-linear effect of the pH on the response variables, without the influences from other covariates (Zuur et al., 2009). Tweedie likelihood function was applied for parameter estimation to account for non-normally distributed response variables and the presence of zeros in the response variable (Lin et al., 2022) using R package mgcv (Wood, 2011). Model selection approach based on Akaike Information Criterion (AIC) was applied to select the best combination of the covariates from all possible combi-
nations using dredge function in R package MuMIn (Barto , 2022 ). The
quarters and transects were always kept in all candidate models to
account for unbalanced spatial and temporal coverage. Models with combinations of possible covariates were fitted and the following criteria were applied to select the best model: (1) a small (< 2) difference in the value of AIC (Burnham and Anderson, 2002); (2) with the smallest number of covariates based on the parsimony principle. Details on selecting the best model for each response variable are shown in Ap- pendix 1.
Then, we added the year effect in the optimal models for the phy- toplanktons, zooplanktons, crab and shrimp larvae, fish eggs, and fish larvae to extract their yearly signals, as in the previous study (Lin et al., 2021a), with pH excluded in the model to keep its effect. The coefficient of the year effect is the logarithm of the relative change of one year compared to the reference year, which was set in the first year of the data (1996). We also fitted tweedie generalized linear model with the pH as the response variables and the years, quarters, transects, and station types as the covariates to extract its yearly signals. To visualize the temporal trends, cubic splines with R function loess were applied to the estimated annual coefficients with a span parametersetat 0.75. Pearson cross-correlation coefficient at a lag of 0 was calculated to test the hy- pothesis that the time series of pH was not associated with the time series of the phytoplanktons, zooplanktons, crab and shrimp larvae, fish eggs, and fish larvae. The significance level was set at 0.05.