Materials and methods
2.1. Preparation and characterization of different nanoplasticss
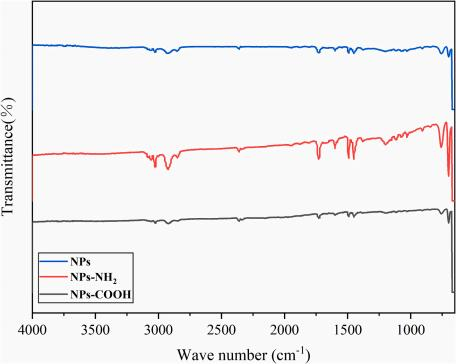
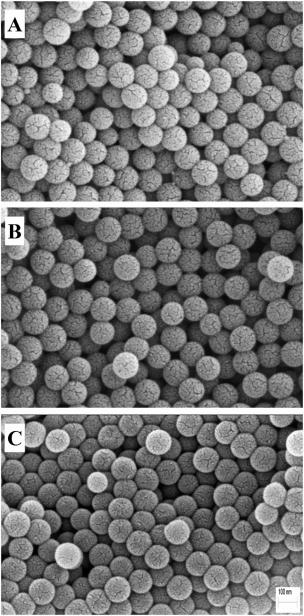
Three kinds of PS nanoplastics (NPs, NPs-NH2, NPs-COOH) (100 nm, spherical type) obtained from Tianjin BaseLine ChromTech Research Centre, China were used in this study for exposure. Before exposure experiments, these nanoplastics were diluted individually in artificial seawater (temperature: 22.1 ± 0.5 ◦ C, salinity: 25.0 ± 0.5 PSU, pH: 8.10 ± 0.05) and processed in an ultrasonic instrument with ultrasonic shaking to prepare a suspension of nanoparticles at a concentration of 1 g/L. The shape and morphology of the nanoplastics were observed by scanning electron microscope (SEM) after drying at 40 ◦ C for 24 hin an oven (Fig. 1). And the spectra of the NPs were characterised by micro fourier transform infrared (μ-FT-IR) spectroscopy (Fig. 2). And the spectral match of the polystyrene was 88.50 %, 94.66 % and 90.34 %, respectively (match >70 %).
2.2.Collection and cultivation of experimental animals
Mussels (Mytilus coruscus) were collected from Shengsi Island, Zhoushan, Zhejiang Province in China. Before exposure, the mussels with similar size and intact shells (shell length: 8.36 ± 0.53 cm; shell width: 2.36 ± 0.24 cm; shell height: 3.94 ± 0.33 cm, n = 96) were selected and temporarily kept in glass tanks (202030 cm, with the artificial seawater volume of approximately 10 L, 8 individuals per aquarium) equipped with air stones, which were used to maintain ox- ygen content and keep the water flow, for one week to remove leftover microplastics and acclimate the laboratory conditions (temperature: 22.1 ± 0.5 ◦ C, pH: 8.10 ± 0.05, salinity: 25.0 ± 0.5 PSU, dissolved ox- ygen concentration: 6.0 ± 0.5 mg/L and light/dark cycle: 12/12 h). During the acclimation period, the mussels were fed twice a day with microalgae, Chlorella vulgaris (2.5 × 10⁵ cells/mL), and the whole seawater was changed two hours after feeding every two days to ensure that they are in good health and condition prior to the experiment. There were no mussels died during the temporary domestication phase.
2.3. Experimental design
Three kinds of PS nanoplastics (NPs, NPs-NH2, NPs-COOH) were used for exposure. Due to the small size of nanoplastics, which are hard to detect, a concentration of microplastics similar to that found in the environment (100 μg/L) was selected for this study (Weiss et al., 2021). Each treatment group had three replicates, and a control group without any nanoplastics was set. During the exposure, the basic culture condi- tions were consistent with those in the domestication stage (tempera- ture: 22.1 ± 0.5 ◦ C, pH: 8.10 ± 0.05, salinity: 25.0 ± 0.5 PSU, dissolved oxygen concentration: 6.0 ± 0.5 mg/L and light/dark cycle: 12/12 h). Every two days,a complete water change was performed using artificial seawater without particles two hours after feeding, and the relevant nanoplastics were added to maintain the specific exposure concentration of nanoplastics. No death of the mussels was observed during exposure. After 28 days of the exposure period, six mussels were randomly selected from each group and dissected to collect their hemolymph, gills and mantle tissues, which were temporarily preserved in liquid nitrogen. After freezing, they were transferred to a freezer at − 80 ◦ C for subse- quent measurements of antioxidant enzymes activity.

2.4. Measurements of antioxidant activity
The antioxidant levels of mussels were reflected by a combination of malondialdehyde (MDA), hydrogen peroxide (H2O2), glutathione (GSH), glutathione peroxidase (GSH-Px), total superoxide disumutase (T-SOD), and catalase (CAT) indicators. H2O2, GSH, T-SOD and CAT were measured using commercial content kits provided by Nanjing Jiancheng Bioengineering Institute (China). MDA and GSH-Px were measured using kits provided by Shanghai yuanye Bio-Technology Co., Ltd. (China).
CAT activity was assessed by the arc-termination of the reaction with ammonium molybdate, resulting in a light yellow complex that was measured at 405 nm. T-SOD activity was assayed using xanthine/
xanthine oxidase method based on the production of O anions at 550
nm (Liu et al., 2013). Based on Jaskot et al. (1983), GSH was quanti- tatively determined using 5,5,-Dithiobis-2-nitrobenzoic acid (DTNB) as substrate by colorimetric determination of yellow compounds produced at 405 nm. The activity of GSH-Px was indirectly estimated by measuring the concentration of yellow anion generated by the catalytic oxidation of GSH with benzoic acid in liquid color development at 422 nm (Liu et al., 2013). H2O2 can interact with molybdic acid, and its content was calculated by measuring complex formation at 405 nm. According to Ohkawa et al. (1979), MDA content was measured by a color reaction based on the reaction of MDA and thiobarbituricacid (TBA) to produce red products at 535 nm.
The absorbance values for all parameters were measured using a microplate reader (Synergy H4, Biotek, USA). The specific experimental steps were carried out in strict accordance with the instructions pro- vided by the kit.
2.5.Statistical analysis
The SPSS statistical software (SPSS Inc., Chicago, IL, USA) was used for data analysis. Shapiro-Wilk test was used to analyze the distribution normality, and Levene's test was used to analyze the homogeneity of variance. One-way analysis of variance (ANOVA) was conducted to determine the statistical differences among the four treatments. Subse- quently, Tukey test was used to analyze the effects of different NPs on oxidative stress in selected tissues (hemolymph, gills and mantle) respectively. The combined effects of different biomarkers were quan- tified by the comprehensive integrated biomarker response (IBR), a method that assesses changes in biomarkers under environmental stress and provides an overall indicator of health response (Beliaeff and Bur- geot, 2002; Devin et al., 2014). In addition, principal component anal- ysis (PCA) was performed on all indicators using the Origin 2018, a dimensionality reduction technique that simplifies high-dimensional data into principal components for easier visualization and interpreta- tion (Jolliffe and Cadima, 2016). The results were presented as the means ± SD, and a significance level of p < 0.05 was considered sta- tistically significant.