Interannual variability of Fe stress in HNLC regions Equatorial Pacific
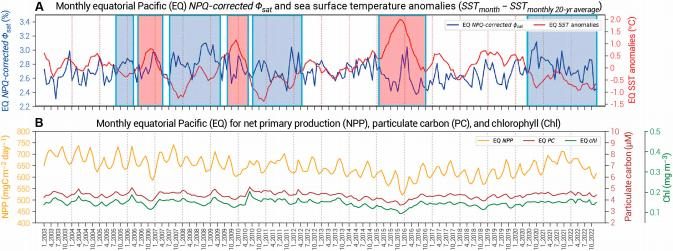
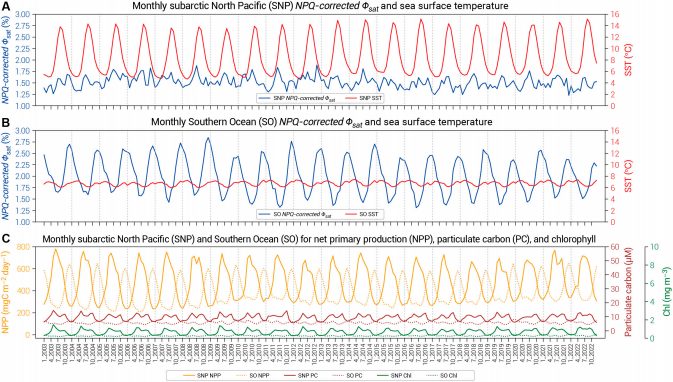
No secular trends in the spatially averaged Fe stress are appar- ent in the 20-year time series in any HNLC region (Figs. 3 and 4). The Fe stress fluctuations in EQ coincide with the monthly average SSTsat anomalies (SSTmonth − SST2003–2022 average) for the same EQ region (10°N to 10°S, 180°W to 85°W),whereas the colder- and warmer-SST anomalies match well with La Niña and El Niño periods, respectively (Fig. 3A). The magnitude of the percentage change in EQ Fe stress increases during LaNiña periods and decreases during El Niño periods, further indicat- ing that Fe stress is tied to the ENSO. The monthly average NPPsat, chlsat, and PCsat values corresponding to the same subset of HNLC regions are plotted, exhibiting an interannual varia- tion that follows seasonal warming and stimulates marine pro- ductivity (Figs. 3 and 4). LaNiñas in 2007 to 2008 and 2010 to 2012 coincide with regional colder-SST anomalies and corre- spond to noticeable low to moderate changes in NPPsat, chlsat, and PCsat. However, the warm-SSTsat peaks, corresponding to El Niños in 2006 to 2007, 2009 to 2010, and 2015 to 2016, cor- respond to strong regional reductions in NPPsat, chlsat, and PCsat. Browning et al. [31] similarly compared 2 decades of MODIS– Aqua Fe limitation data with Niño 3 data (Eastern Tropical Pacific [5°N to 5°S, 150°W to 90°W]) and found stronger Fe limitation under warmer, low-chlsat conditions; greater upwell- ing conditions supplied more Fe, diminishing the Fe limitation levels and increasing chl concentrations. The authors men- tioned no evidence of Fe limitation declines at the highest SST anomalies. In the present study, we expanded the region of interest (10°N to 10°S, 180°Wto 85°W) and found the opposite
results. Colder-SST anomalies cause immediate increases in Fe stress signals, suggesting that the whole EQ region remains Fe limited even if the Eastern Tropical Pacific is temporarily sup- plied with Fe from upwelling. Additionally, the upwelling in the Eastern Tropical Pacific may contribute to temporary Fe stress reductions and increase chl, but at the carrying capacity or under Fe-depleted conditions, elevated Fe stress mayimme- diately follow. Our sensitivity analysis shows that increasing chl by an order of magnitude will decrease Fe stress by 5 times while keeping iPAR and nFLH constant. Moreover, the Fe-rich sediments off the coast of Peru are far enough from our EQ region of interest. In the presence of high dissolved Fe(II) (>40 nM) from suboxic waters in contact with organic-rich shelf sediments, dissolved Fe will be high up to 100 m within 10 km of shore at 10°S [49,50]. Thus, a longitude of 85°W is distant enough for the sediment Fe supply to be trapped in the shelf relative to north-central Peru and not affect our results.
Interestingly, the elevated Fe stress response exhibits a short lag during warmer-SST anomalies and corresponding El Niño phases. At the highest warmer-SST anomaly (during the intense El Niño in 2015 to 2016), 2 Fe stress peaks appear consecutively, with the second peak being greater than the first peak, while warmer-SST anomalies decrease and NPPsat, chlsat, and PCsat increase. This increase in the Fe stress signal with the marine productivity signal maybe due to phytoplankton adaptation to lower Fe requirements. However, in situ measurements of phy- toplankton community shifts are needed for verification.